
Photo: HybridFitty / Wikimedia Commons, CC BY 4.0 (cropped and resized). Sandbag lunges at HYROX Stockholm, 2023.
Key Takeaways
Running is the race. In seven seasons of PRO results, running made up roughly half of total race time for the fastest athletes, and most of their improvement came from faster running (Rappelt et al., 2026).
The engine predicts the finish. In the first laboratory study of HYROX, higher VO₂max, more weekly endurance training and lower body-fat percentage were linked to faster times. Grip strength and resistance-training volume were not (Brandt et al., 2025).
Strength still matters, especially if you're slower. The strength-heavy stations reshuffled rankings the most and cost slower athletes the most time (Rappelt et al., 2026).
Most injuries are overuse, mostly in the legs. In a 12-week study of 89 athletes, 73% of injuries were overuse and the knee was the most commonly injured area (Chittenden et al., 2026).
HYROX has gone from a niche event to one of the fastest-growing formats in fitness. Between its launch and the 2023/24 season, 278,063 participants raced in 145 events across 22 countries (Fernández-Navarrete et al., 2026). For 2027, the American College of Sports Medicine's worldwide survey of fitness professionals ranked "Competitive Fitness Events" in its top 20 trends for the first time (ACSM, 2026).
The format is simple: eight 1-km runs, each followed by one of eight workout stations, always in the same order: SkiErg, sled push, sled pull, burpee broad jumps, rowing, farmers carry, sandbag lunges and wall balls (Brandt et al., 2025). Because the course never changes, every finish time can be compared, which is a big part of why it appeals to competitive people.
Until recently there was almost no research on it. Now there is a small but useful body of peer-reviewed work. Here is what it shows, and what it means for how you train.
What a HYROX Race Actually Demands
The first scientific study of HYROX, from the University of the Bundeswehr Munich, had 11 recreational athletes complete a simulated race to the Individual Open standard while researchers tracked heart rate, blood lactate and perceived exertion (Brandt et al., 2025).
The median finish was 86.5 minutes. Of that, 51.2 minutes were spent running and 32.8 minutes at the stations. Athletes spent about 79.5% of the race above 90% of their maximum heart rate. Blood lactate and perceived effort peaked at the stations, and the highest readings came at the final station, the wall balls.
In other words, HYROX is a long, sustained, hard effort. It is closer to an endurance race with heavy interruptions than to a strength test with some jogging in between.
Elite racing tells a similar story. In a study of 24 PRO men at HYROX Madrid 2025, average running speed fell from 16.1 km/h on run 1 to 13.6 km/h on run 8. On average the athletes ran at about 84% of the speed at their second ventilatory threshold, a submaximal pace they could hold across the whole race (Gutiérrez-Hellín et al., 2026).
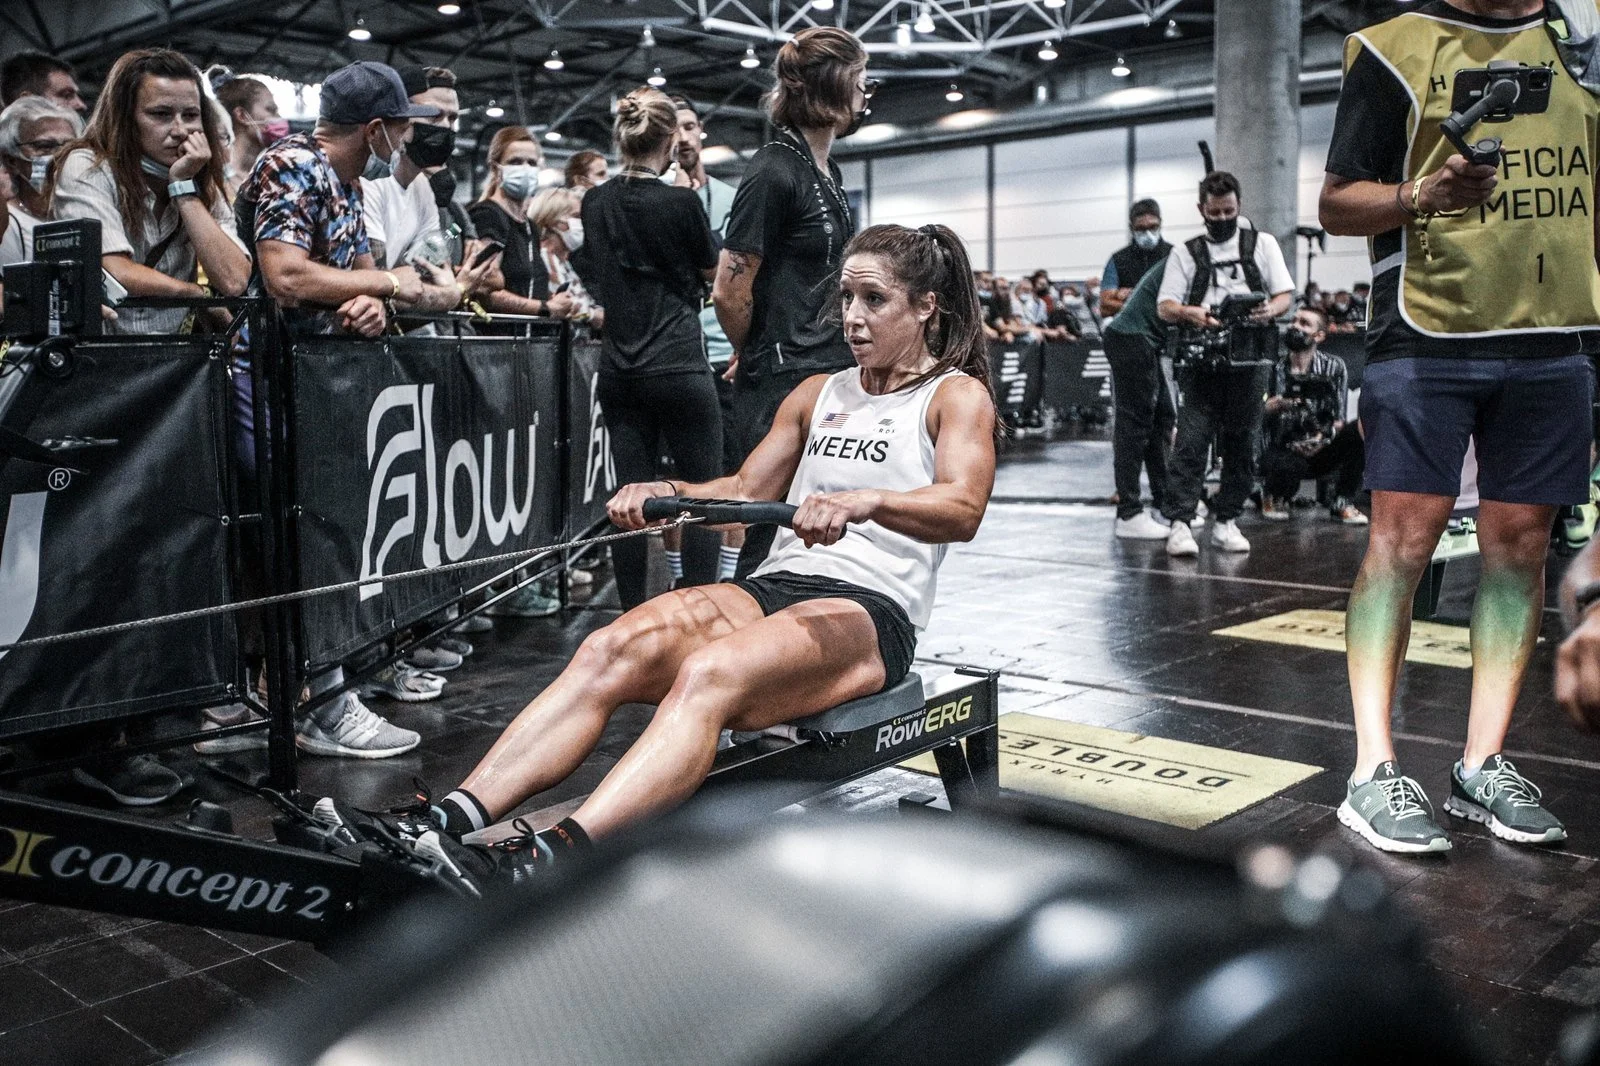
Photo: HybridFitty / Wikimedia Commons, CC BY 4.0 (cropped and resized). The rowing station at the 2021 HYROX World Championships.
Running Is About Half the Race
The largest dataset so far comes from researchers at the German Sport University Cologne. They analysed 39,696 PRO and ELITE results from HYROX's first seven seasons, 2018/19 to 2024/25 (Rappelt et al., 2026).
Three findings stand out:
Running consistently accounted for about 50% of total race time among the 100 fastest PRO results each season.
The field got much faster. Among those top 100 results, average race time dropped by about 13 minutes (19%) for men and about 17 minutes (21%) for women from season 1 to season 7. Faster running accounted for most of that: about 8 minutes for men and 10 minutes for women.
Competition got tighter. Median ELITE times fell from 1:06:24 to 0:57:17 for men and from 1:11:09 to 1:03:22 for women, while the spread between athletes narrowed.
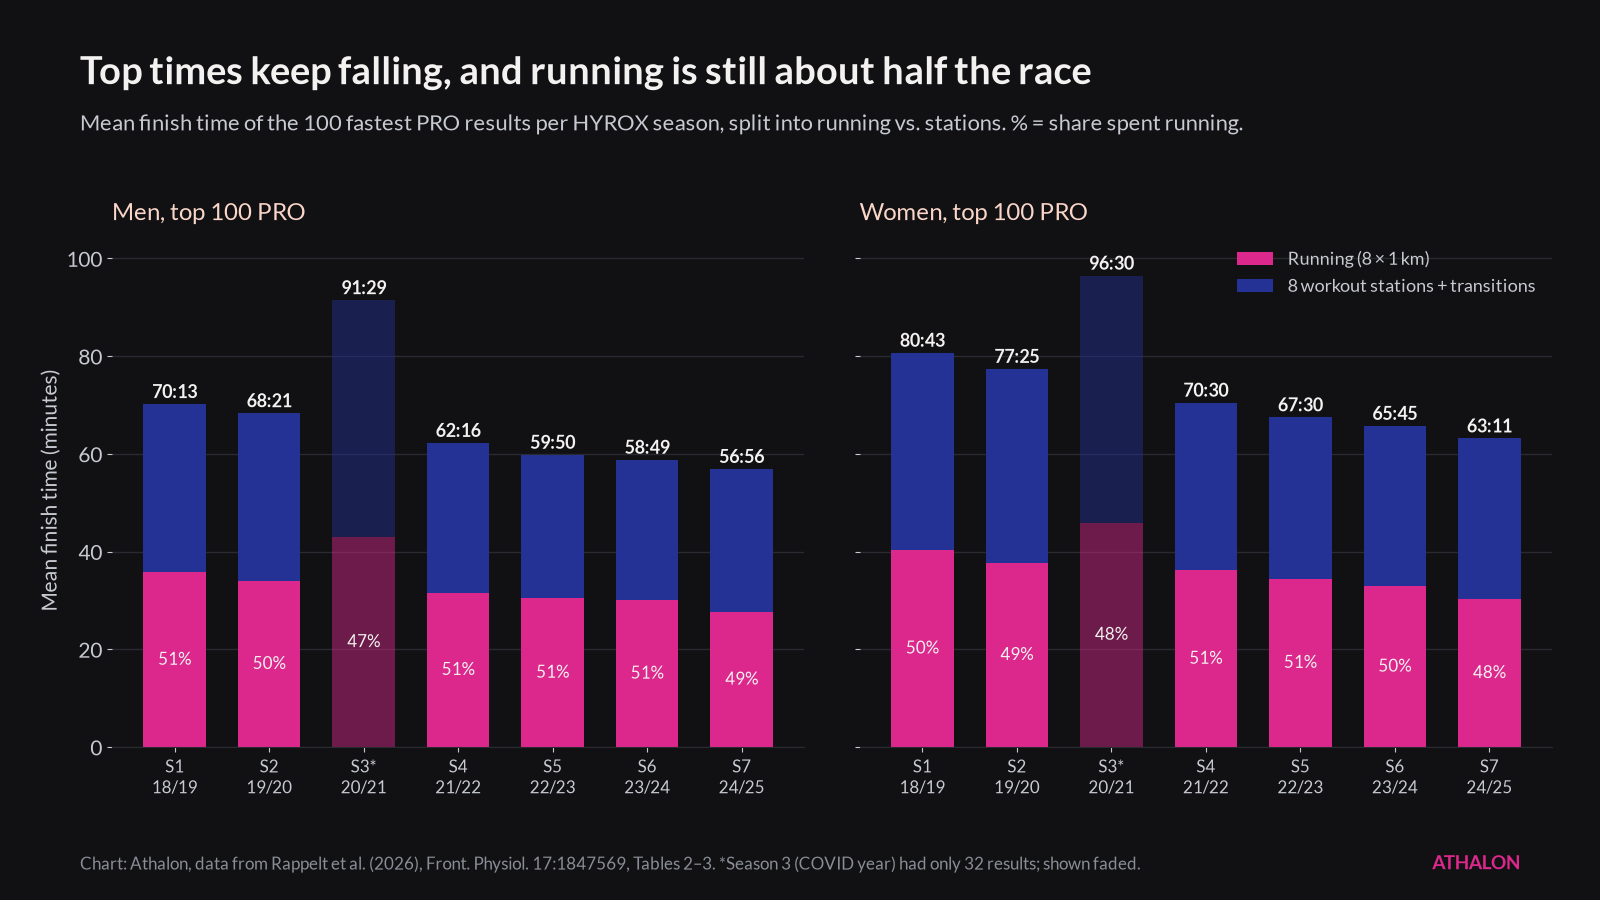
Chart: Athalon, data from Rappelt et al. (2026), Frontiers in Physiology, Tables 2 and 3. Season 3 had only 32 results and is shown faded.
Strength Still Separates the Field
If running is half the race, does strength matter at all? The data say yes, but in a specific way.
In the Cologne analysis, a runner's running rank stayed close to their overall rank. The strength-dominated stations, such as the sled push, reshuffled the rankings much more. The researchers also found "larger absolute changes in total time per unit increase in discipline time among slower performers" (Rappelt et al., 2026). Put simply, if you are strong enough to move the sled efficiently, it costs you little. If you aren't, it can cost you minutes.
The Munich lab study points the same way. Faster finishes correlated with higher VO₂max (ρ = −0.71), more weekly endurance training (ρ = −0.68) and lower body-fat percentage (ρ = 0.67, meaning more body fat went with slower times). Hand-grip strength and weekly resistance-training hours showed no significant relationship (Brandt et al., 2025). The authors concluded that HYROX places an emphasis on endurance with "moderate to low requirements in terms of maximum strength" compared with other high-intensity functional training.
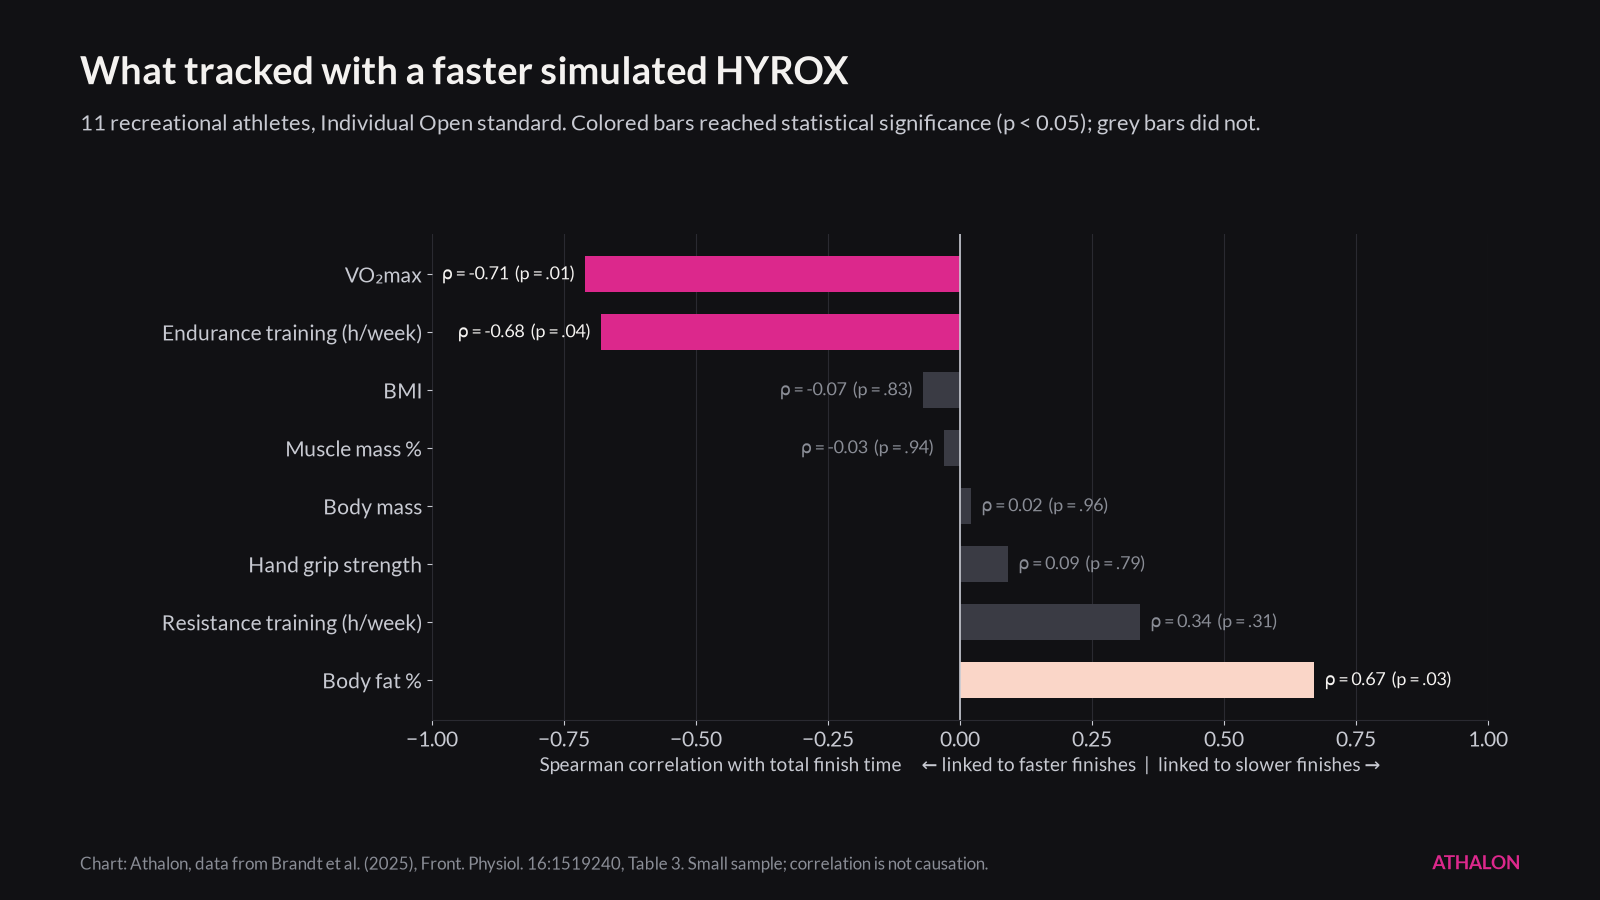
Chart: Athalon, data from Brandt et al. (2025), Frontiers in Physiology, Table 3. n = 11; correlations show association, not cause.
These numbers come with caveats. The Munich study had 11 participants who raced alone in a simulated event, and correlation is not causation. Still, the pattern is consistent across studies: build the aerobic engine first, then build enough strength that the stations stop slowing you down.

Photo: Staff Sgt. Vontrae Hampton, U.S. Army Reserve / DVIDS via Wikimedia Commons, public domain (cropped and resized). U.S. Army soldiers carry sandbags during a team HYROX event at Vilseck, Germany, May 2026. Use of U.S. military imagery does not imply DoD endorsement.
Where HYROX Athletes Get Hurt
The first prospective injury study tracked 89 HYROX athletes every week for 12 weeks (Chittenden et al., 2026). The main results:
In an average week, 30% of athletes reported some health problem and 18% reported a substantial one.
There were 14.4 injuries per 1,000 hours of training.
73% of injuries were overuse injuries rather than sudden ones.
The knee accounted for 22% of injury episodes. The knee and the lower leg/Achilles carried the greatest overall burden, and the elbow was also notable because of a few severe cases. Shoulder problems were nearly absent.
Only about half of the problems caused missed training, so counting missed days alone understates the issue.
Where the cause of an injury was recorded (30 of 63 episodes), running was the most common at 43%. As untested prevention targets, they suggested managing how quickly running volume is increased and building calf and Achilles loading capacity. A time-loss injury in the previous 12 months was the strongest candidate risk marker, linked to about 2.6 times greater cumulative injury severity. However, the analysis was exploratory and the confidence interval (1.00–6.75) was also compatible with no effect.
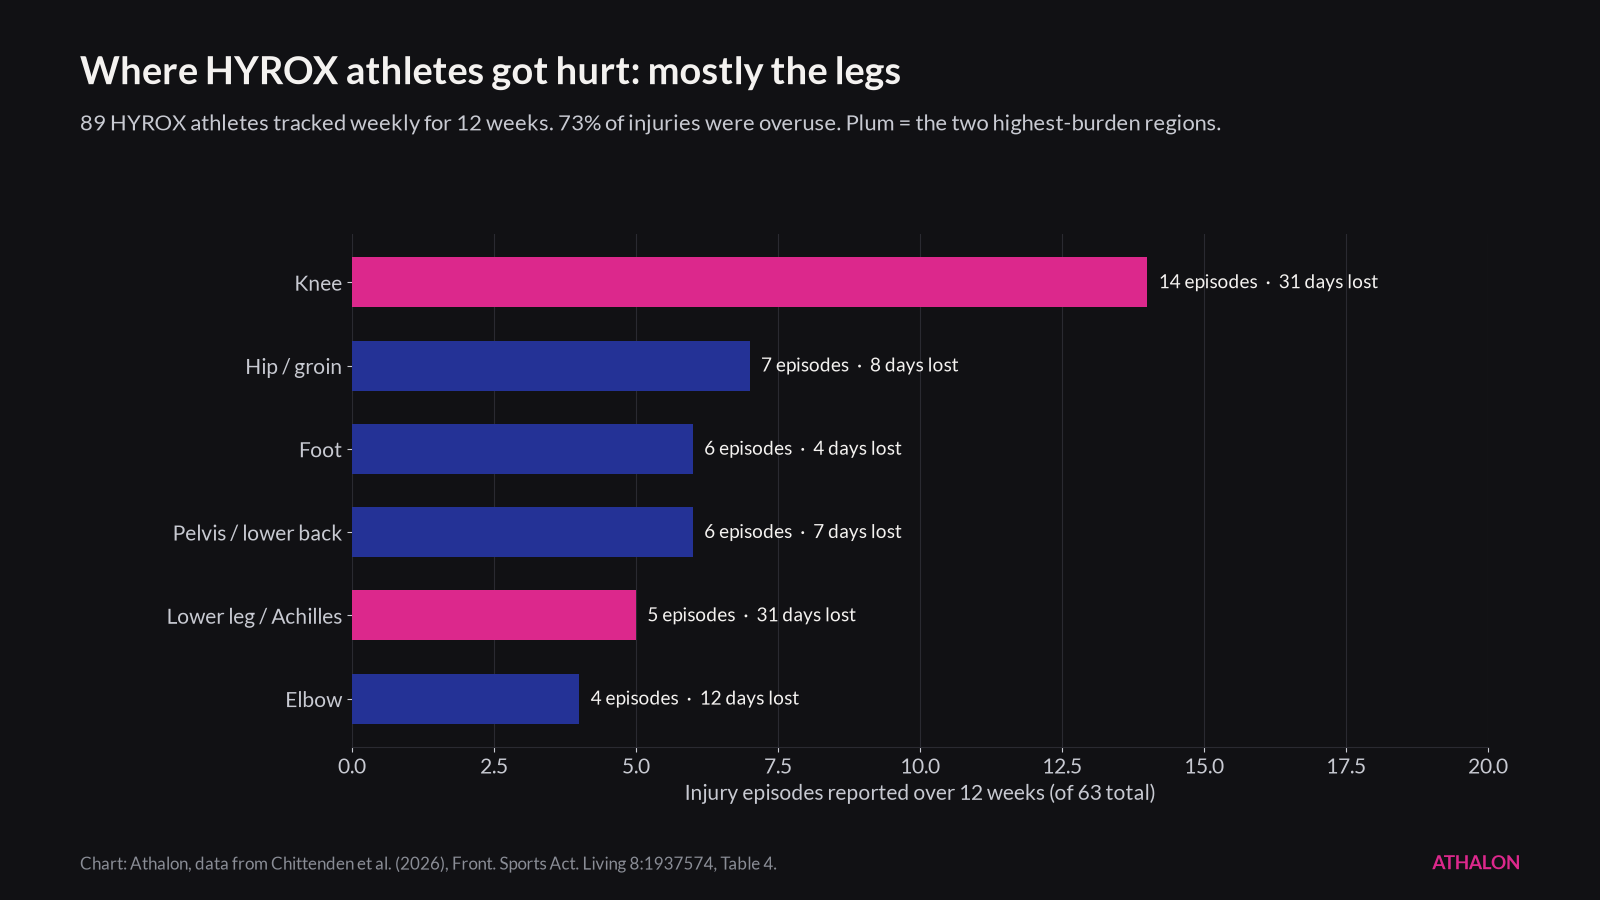
Chart: Athalon, data from Chittenden et al. (2026), Frontiers in Sports and Active Living, Table 4.
How to Train for HYROX, Based on the Evidence
None of these studies tested a training program, so treat the points below as evidence-informed principles, not a proven plan.
Prioritize aerobic capacity. VO₂max and endurance-training volume were the strongest correlates of finish time (Brandt et al., 2025), and running made up about half of race time (Rappelt et al., 2026).
Practice running when you're already tired. The Munich authors recommend combining running with HYROX movements in training, so you can improve your running economy when pre-fatigued and practice moving between efforts.
Get strong enough for the stations, then maintain it. If heavy sleds or lunges are your weak point, the Munich authors suggest a block that emphasizes resistance training. A meta-analysis of concurrent training found that endurance training can blunt strength and muscle gains, and that the effect depended on the type, frequency and duration of the endurance work. Running interfered more than cycling (Wilson et al., 2012). Where you can, separate hard strength and hard endurance sessions, or do the higher-priority one first (Brandt et al., 2025).
Increase your running volume gradually and take knee and calf symptoms seriously. This follows the injury pattern above (Chittenden et al., 2026). If you have a current injury or medical condition, talk to a qualified clinician before starting high-intensity training.
Measure your splits. Researchers have published normative benchmarks for every HYROX segment, from more than 186,000 race results, so athletes can see which stations are holding them back (Fernández-Navarrete et al., 2026).
Done well, this kind of training also meets the World Health Organization's guidance for adults: 150–300 minutes of moderate or 75–150 minutes of vigorous aerobic activity a week, plus regular muscle-strengthening work (Bull et al., 2020).
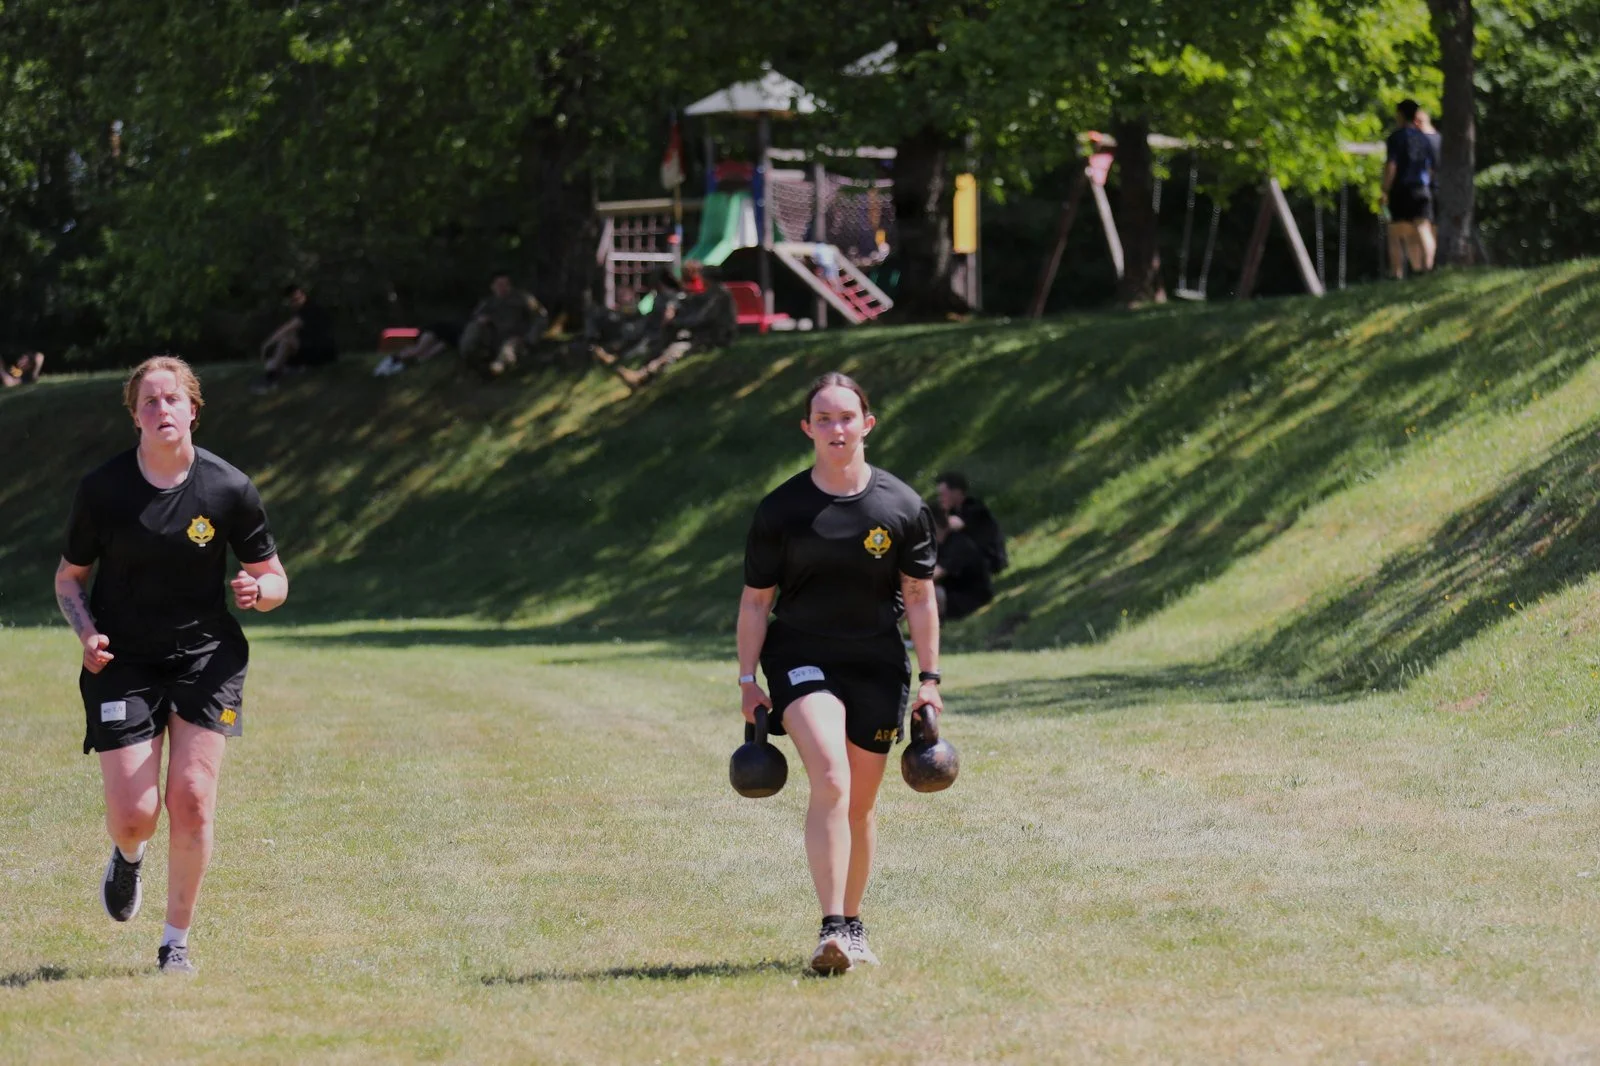
Photo: Staff Sgt. Vontrae Hampton, U.S. Army Reserve / DVIDS via Wikimedia Commons, public domain (cropped and resized). Farmers carry during a women's doubles HYROX event at Vilseck, Germany, May 2026. Use of U.S. military imagery does not imply DoD endorsement.
Conclusion: A Race You Can Measure
HYROX works because it is measurable. The course is the same every time, so you can compare your splits from race to race. The research so far points in a clear direction: build your aerobic base, get strong enough that the stations stop costing you time, and manage your running load to avoid overuse injuries.
The studies are still early. Most are small, a few use race data instead of controlled trials, and none has yet compared training programs head to head. Expect the advice to sharpen as more research comes out.
Train with a scoreboard. If you're building toward a race like this, it helps to see your progress against other people. In the Athalon app you can create competitions with friends, log your lifts and runs, and see where you stand on the leaderboard. Download Athalon on the App Store.
Athalon is not affiliated with or endorsed by HYROX.
Frequently Asked Questions
Q: How long does a HYROX race take?
A: It depends on your level and division. In a simulated Individual Open race, recreational athletes took a median of 86.5 minutes (Brandt et al., 2025). The median ELITE men's time in season 7 was 57:17, and the median women's time was 1:03:22 (Rappelt et al., 2026).
Q: Is HYROX more about running or strength?
A: Running takes up about half of race time and was the strongest driver of improvement among top athletes. Strength matters most for athletes whose station times are slow (Rappelt et al., 2026).
Q: What are the most common HYROX injuries?
A: Mostly overuse injuries, with the knee most often affected and the knee and lower leg/Achilles carrying the most burden. Shoulder injuries were rare in the one prospective study so far (Chittenden et al., 2026).
References
Brandt, T., Ebel, C., Lebahn, C., & Schmidt, A. (2025). Acute physiological responses and performance determinants in Hyrox© – a new running-focused high intensity functional fitness trend. Frontiers in Physiology, 16, 1519240. https://doi.org/10.3389/fphys.2025.1519240
Rappelt, L., Wiedenmann, T., Held, S., Heinke, L., Micke, F., Wicker, P., & Donath, L. (2026). Longitudinal performance development in PRO and ELITE HYROX competitions across the first seven competitive seasons. Frontiers in Physiology, 17, 1847569. https://doi.org/10.3389/fphys.2026.1847569
Chittenden, E., Bell, A., Forbes, G., Tooth, P., Porter, R., Van Der Vliet, R., Shouman, K., & Williams, S. (2026). Prevalence, burden and risk markers of health problems in HYROX athletes: a 12-week prospective cohort study. Frontiers in Sports and Active Living, 8, 1937574. https://doi.org/10.3389/fspor.2026.1937574
Gutiérrez-Hellín, J., Alonso-Domínguez, S., Gil-Cabrera, J., et al. (2026). Relative running intensity and pacing during an official HYROX PRO MEN competition: The HYScience study. International Journal of Sports Physiology and Performance. https://doi.org/10.1123/ijspp.2026-0098
Fernández-Navarrete, I., Ruiz-Alias, S. A., Gómez-García, M., Riquelme-Sebastián, L., & García-Pinillos, F. (2026). Hyrox©: A descriptive analysis of participation trends among over 275,000 athletes in the new fitness modality. Research Quarterly for Exercise and Sport, 97(2), 266–272. https://doi.org/10.1080/02701367.2025.2584226
Fernández-Navarrete, I., Ruiz-Alias, S. A., & García-Pinillos, F. (2026). Where am I struggling? Detailed benchmarks for every workout and category in Hyrox© competition. Journal of Sports Medicine and Physical Fitness, 66(10), 1087–1094. https://doi.org/10.23736/S0022-4707.26.17926-2
Wilson, J. M., Marin, P. J., Rhea, M. R., Wilson, S. M., Loenneke, J. P., & Anderson, J. C. (2012). Concurrent training: a meta-analysis examining interference of aerobic and resistance exercises. Journal of Strength and Conditioning Research, 26(8), 2293–2307. https://doi.org/10.1519/JSC.0b013e31823a3e2d
Bull, F. C., Al-Ansari, S. S., Biddle, S., et al. (2020). World Health Organization 2020 guidelines on physical activity and sedentary behaviour. British Journal of Sports Medicine, 54(24), 1451–1462. https://doi.org/10.1136/bjsports-2020-102955
American College of Sports Medicine. (2026). 2027 ACSM Worldwide Fitness Trends: Future Directions of the Health and Fitness Industry (summary slides). https://www.acsm.org/wp-content/uploads/ACSM-2027-Trends-PowerPoint-Template_FINAL.pdf
